 Apply for Citigold
 Citi Wealth Perspectives
 Citi Plus
 Digital Banking
 Apply for International Banking Account
 Citibank Debit Mastercard
 Activate your Citibank Debit Mastercard
 Our Wealth Philosophy
 Citi FX Calculator
 Get Travel Insurance Quote
 Apply for Citi Credit Card
 Citi PayAll
 Card Services
 Manage Your Credit Application
 Refer a friend to Citi Credit Card
 Manage Your Mortgage Application
Singapore Quarter 1, 2025
Market commentary
Approaching cross-currents
1Q 2025 AT A GLANCE
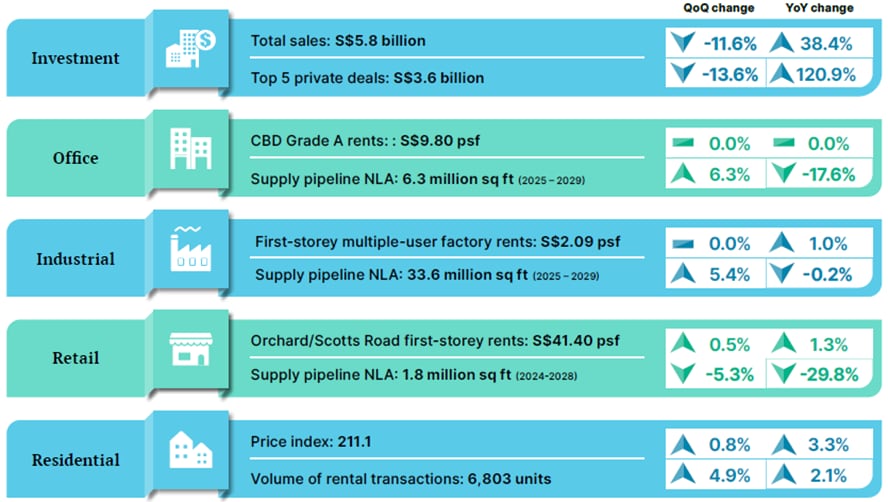
KEY HIGHLIGHTS
Residential
Singapore’s residential property prices rose 0.8% q-o-q in 1Q 2025, led by a 1.0% increase in non-landed home prices, with the non-landed RCR posting the strongest growth at 1.7%. In the rental market, prices edged up 0.4%, supported by stable demand and rising transaction volumes.
Investment
Singapore’s investment sales hit S$5.8 billion in 1Q 2025, with landmark deals signalling strong market appetite. With Government Land Sales momentum and a S$20-24 billion forecast, investors are poised to seize prime opportunities in a thriving market.
Retail
Singapore’s retail scene kicked off 2025 steadily, with tourist arrivals holding firm at 4.3 million—signalling a strong return to pre-pandemic vibrancy. Despite the slight dip in occupancies, resilient suburban demand and rising prime rents reflect a market bracing for growth amid a buzzing calendar of MICE events and headline concerts.
Office
Singapore’s office rents edged up 0.3% q-o-q, marking a reversal from two consecutive quarters of decline. Island-wide office occupancy rates dipped 0.3 percentage points to 94.5% in 1Q 2025, a decline attributed to the completion of new developments such as Keppel South Central and Paya Lebar Green, as newly available space takes time to be absorbed by the market. Net absorption rose to 518,000 sq ft, supported by pre-commitments from the new completions.
ECONOMY
KEY INDICATORS
GDP Growth
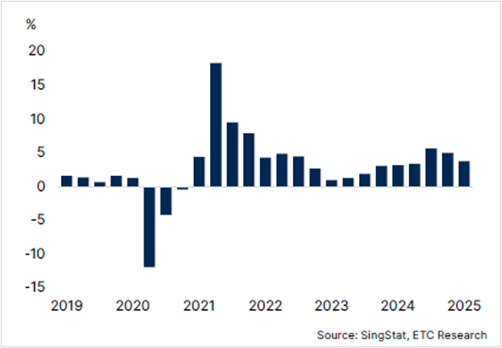
Based on advanced estimates, the Singapore economy grew 3.8% y-o-y in 1Q 2025, slowing from the 4.3% y-o-y growth recorded in 4Q 2024. MTI has revised Singapore’s GDP growth forecasts for 2025 to 0.0% to 2.0%, down from the previous projection of 1.0% to 3.0%.
Inflation

Core inflation fell to 0.6% in February 2025, the lowest growth since April 2021. According to MAS, the core inflation and headline inflation is forecasted at 0.5% to 1.5% for 2025, down from previous projections of 1% to 2% and 1.5% to 2.5%, respectively.
Non-oil Domestic Exports

Non-oil domestic exports (3MMA y-o-y) rose steadily by 4.5% in February 2025 following the 3.2% increase in January 2025. Both electronics and non-electronics products saw growth in February 2025.
International Visitor Arrivals

International Visitor Arrivals (IVA) were recorded at 4.3 million in 1Q 2025. According to STB, IVA is projected at 17 to 18.5 million in 2025 and tourism receipts is projected to be between S$29 billion and S$30.5 billion.
INVESTMENT
1Q 2025 momentum fuels bright outlook
KEY HIGHLIGHTS
Investment Sales Sectorial Contribution (%)

Investment Sales (S$ billion)

Selected Private Investment Sales Transaction 1Q 2025
![]()
Market Commentary
- In 1Q 2025, total investment sales in Singapore amounted to S$5.8 billion, marking an 11.6% q-o-q decrease from S$6.5 billion in 4Q 2024. However, on a y-o-y basis, it gained 38.4% from S$4.2 billion in 1Q 2024.
- During the quarter, six Government Land Sales (GLS) sites were awarded — Dairy Farm Walk, Tengah Garden Avenue, River Valley Green (Parcel B), Bayshore Road, Media Circle (Parcel A) and Kaki Bukit — significantly contributing S$3.6 billion to total investment sales. Developers have regained confidence in the market, buoyed by strong take-up rates at recent new launches. However, they remain measured in their land acquisition strategies, mindful of rising development costs and lingering economic uncertainties.
- The private sector recently experienced its first successful collective sale seeing River Valley Apartment, a freehold, four-storey walk-up block, being sold for S$56 million. The commercial market continued to show strong activity, highlighted by the landmark acquisition of Northpoint City South Wing for S$1.13 billion, announced in late March. Additionally, the hospitality sector witnessed a significant transaction with the sale of Oakwood Studio Singapore for S$153 million, demonstrating strong investor confidence in Singapore’s recovering tourism industry, which is further supported by government initiatives aimed at increasing international visitor arrivals.
Market Outlook
- Total investment sales in Singapore’s real estate market is projected to reach S$20-24 billion in 2025, driven by sustained demand and strategic opportunities. However, elevated global interest rates and stabilised, yet high borrowing costs in Singapore will continue to influence market dynamics. Rising construction and labour costs are expected to further pressure developers’ margins, reinforcing their cautious approach to land acquisitions. Despite these challenges, Government Land Sales will remain a pivotal driver, with upcoming tenders for well-located residential and mixed-use sites anticipated to attract competitive bids, bolstering market activity.
RESIDENTIAL
Price growth moderates as demand and supply balances
KEY HIGHLIGHTS
Residential Supply Pipeline

Property Price Index

Residential Sales and Launch Volume

Market Commentary
- The residential price index rose 0.8% in 1Q 2025, recording a second consecutive price increase, albeit at a more moderate pace compared to the 2.3% recorded in 4Q 2024.
- The landed segment saw an increase of 0.4% in 1Q 2025, reversing the 0.1% decline in 4Q 2024. Meanwhile, the non-landed property price index rose 1.0% q-o-q in 1Q 2025, moderating from the 3.0% q-o-q recorded in 4Q 2024.
- In the non-landed segment, all regions showed a moderation in price growth even as demand remained healthy. CCR non-landed properties recorded a 0.8% q-o-q growth, extending the 2.6% q-o-q growth in 4Q 2024 albeit at a more moderate pace. The RCR non-landed properties grew the most at 1.7% q-o-q in 1Q 2025, recording a fifth consecutive quarter growth. Meanwhile, OCR non-landed properties grew 0.3% q-o-q in 1Q 2025. Growth rates in all three regions were recorded between 2.6% to 3.3% for 4Q 2024.
- Transaction volume was recorded at 7,261 units in 1Q 2025, a 1.3% q-o-q decrease from the 7,433 units in 4Q 2024. Primary sale transactions, which recorded 3,375 units in 1Q 2025, were recorded as the second-highest quarterly new sales performance in the last three years. Due to the increased primary sale transactions, the secondary sale market’s performance was more muted, recording 3,886 units in 1Q 2025, down 3.2% from 4,013 units in 4Q 2024.
- In the rental market, the overall rental index rose 0.4% in 1Q 2025, showing stability with price changes within a 1% variance in the last four quarters. Rental transaction volume in 1Q 2025 rose 2.2% to 20,409 transactions, showing sustained and stable demand for residential rental units.
Market Outlook
- With the residential market largely driven by domestic purchasers, buyer sentiment is expected to remain favourable in 2025. At the same time, the residential property price index is anticipated to moderate, as overall housing supply rises with the ramp-up of Government Land Sales — a trend that should help support market stability and sustain healthy transaction activity.
- In the rental market, downward pressure on rents is expected to ease, supported by a more moderate supply pipeline. Around 4,000 private residential units are scheduled for completion over the rest of 2025, bringing total completions for the year to approximately 5,900 units — a healthy adjustment from the 8,500 units delivered in 2024, which should help stabilise rental conditions.
RETAIL
Prime retail rents climb despite softening occupancy
KEY HIGHLIGHTS
Retail Prime Rental Rents

Retail Supply Pipeline (NLA)

Selected Retail Pipeline

Market Commentary
- In 1Q 2025, international visitor arrivals held steady at 4.3 million, unchanged from 1Q 2024. This aligns with the Singapore Tourism Board’s full-year 2025 forecast of 17 to 18.5 million visitors. The tourism sector continues to exhibit a robust recovery, with figures in the early part of the year signalling a return to pre-pandemic levels.
- In 1Q 2025, Singapore’s island-wide retail occupancy rate fell to 93.2% from 93.8% in 4Q 2024, with central area retail spaces seeing the most significant declines, as leasing demand turned more selective amid shifting consumer preference within the Food and Beverage sector. Orchard/Scotts Road occupancy rate recorded a slight q-o-q decrease to 93.2% from 93.7% in 4Q 2024, while the Other City Area decreased to 92.5% from 93.2%. Meanwhile, Fringe/Suburban Area experienced a minor q-o-q decline from 94.1% to 93.5%, demonstrating resilient demand.
- In 1Q 2025, prime first-storey rental rates on Orchard/Scotts Road increased by 0.5% to S$41.40 per sq ft reflecting strong demand from selective retailers targeting high-visibility, premium malls amid recovering tourist arrivals of 4.3 million. Fringe/Suburban retail markets saw rental rates rise to S$34.35 per sq ft due to robust local demand, limited new retail supply, and the appeal of well-managed malls with high footfall. Rental rates in Other City Areas remained stable at S$19.40 per sq ft, benefiting from steady demand for cost effective spaces, though growth is tempered by competition from suburban hubs and cautious consumer spending.
- In the first quarter of 2025, several projects with significant retail components were completed. Notable among these is The Cathay, a mixed-use development that features 168,000 sq ft of retail space. Additionally, the redeveloped Grand Hyatt Hotel Singapore introduced new retail spaces during the same period.
Market Outlook
- While the retail sector continues to grapple with inflation driven rises in construction, labour, and operating costs — factors that may lead to upward pressure on rents and challenge cost-sensitive retailers — the outlook remains promising. A robust line-up of MICE events and concerts is set to fuel the tourism rebound, which is expected to drive stronger footfall and bolster demand for prime retail spaces.
OFFICE
Further concentration to CBD Grade A office spaces
KEY HIGHLIGHTS
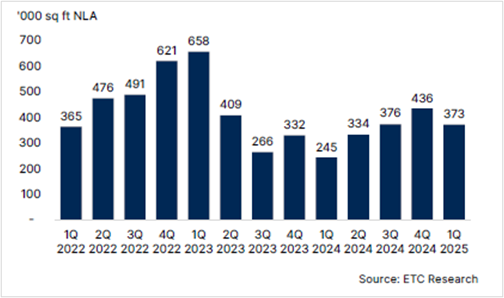
CBD Premium and Grade A Office Net Absorption

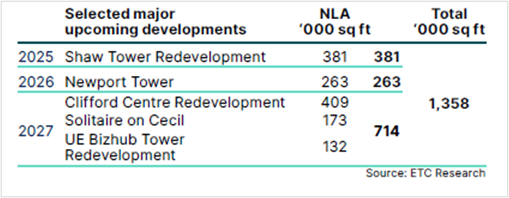
Shadow Space (NLA) and Office Supply Pipeline
Shadow Space (NLA) and Office Supply Pipeline
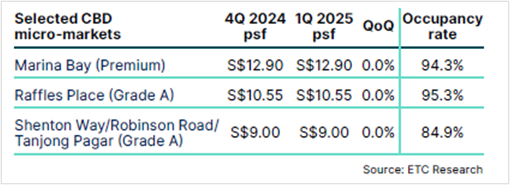
Average office rents and occupancy rates
Market Commentary
- Rental rates in Singapore’s central region rose 0.3% q-o-q in 1Q 2025, breaking its two consecutive quarters of decline.
- Island-wide office occupancy rates eased by 0.3 percentage points to 94.5% in 1Q 2025. In the CBD, occupancy slipped to 93.6% from 94.1% in 4Q 2024. In the decentralised areas, occupancy declined to 94.0% from 94.9% in 4Q 2024. This moderation in occupancy may be temporary, largely an effect of the new supply that came onstream from Keppel South Central and Paya Lebar Green during the quarter. Both developments reported pre-occupancy rates of around 30% and 25% respectively.
- Non-CBD areas, on the other hand, saw occupancy rates increase by 0.9 percentage points to 96.7%, due to the take-up of office spaces in the City Hall/Bugis and the Bras Basah areas.
- Island-wide net absorption rose to a robust 518,000 sq ft (NLA) in 1Q 2025, indicating the market’s resilient underlying demand. In the CBD, net absorption reached a healthy 214,000 sq ft, on the back of the 192,000 sq ft of office space from Keppel South Central, as occupiers continued to show a clear preference for premium and Grade A office spaces. In the non-CBD markets, net absorption also strengthened, rising by 146,000 sq ft, led by strong take-up in the City Hall/Bugis area and Bras Basah, which recorded 90,000 sq ft and 41,000 sq ft, respectively.
- Despite the Paya Lebar Green coming on stream, the decentralised areas saw a negative net absorption of 35,000 sq ft in 1Q 2025, with Alexandra area seeing 70,000 sq ft of office spaces being given up, offset by a take up of 49,000 sq ft in Jurong.
- Shadow space saw its first decline after four quarters of consecutive increase, falling 14.4% q-o-q to 373,000 sq ft in 1Q 2025. The decrease in shadow space is attributed to the take up of CBD area office spaces, underscoring a preference for corporate offices in central locations.
Market Outlook
- In 2025, rental growth for CBD premium and Grade A office spaces is expected to see a modest increase, supported by a limited new supply pipeline — with only Shaw Tower and Newport Tower anticipated to achieve TOP by late 2025. Demand is also reinforced by tenants repositioning toward higher-grade offices. Emerging downside risks, stemming trade tensions and tariff uncertainties, could weigh on the outlook.
GENERAL DISCLOSURE
DISCLAIMER - EDMUND TIE & COMPANY
This report should not be relied upon as a basis for entering into transactions without seeking specific, qualified, professional advice. Whilst facts have been rigorously checked, Edmund Tie & Company can take no responsibility for any damage or loss suffered as a result of any inadvertent inaccuracy within this report. Information contained herein should not, in whole or part, be published, reproduced or referred to without prior approval. Any such reproduction should be credited to Edmund Tie & Company.
© Edmund Tie & Company 2025
Source: Edmund Tie & Company. Reproduced with permission.
Citibank Disclaimers and Important Notices
DISCLAIMER – CITIBANK
The market data and information herein contained (“Information”) is the product or service of a third party not affiliated to Citibank Singapore Limited (“CSL”) or its related entities. None of the Information represent the opinion of, counsel from, recommendation or endorsement by CSL, its related entities and their respective officers, employees, directors and agents (collectively, the “CSL Group”).
The Information is provided for general information and/or educational purposes only. No part of the Information may be reproduced without the prior written permission of CSL.
NO WARRANTY
The Information is provided “as is”, without warranty of any kind, it has not been independently verified by CSL Group and use of the Information is at your sole risk. The CSL Group shall not be liable and expressly disclaim liability for any error or omission in the content of the Information, or for any actions taken by you or any third party, in reliance thereon. The Information is not guaranteed to be error-free, or to be relied upon for investment purposes, and the CSL Group makes no representation or warranty as to the accuracy, truth, adequacy, timeliness or completeness, fitness for purpose, title, non infringement of third party rights or continued availability of the information.
LIMITATION OF LIABILITY
To the maximum extent permitted by law, the CSL Group shall not be liable for any loss or damage of any kind whatsoever (including, without limitation, any special, consequential, incidental or indirect damages, or damages for loss of profits, business interruption, and any and all forms of loss or damage, regardless of the form of action or the basis of the claim, whether or not foreseeable) arising out of the use of the information (provided in any medium), even if any member of the CSL Group, has been advised of the possibility of such loss or damage.
© 2025 CITIBANK
CITIBANK IS A REGISTERED SERVICE MARK OF CITIGROUP INC. OR CITIBANK, N.A.
CITIBANK SINGAPORE LIMITED. CO REG. NO. 200309485K