 Apply for Citigold
 Citi Wealth Perspectives
 Citi Plus
 Digital Banking
 Apply for International Banking Account
 Citibank Debit Mastercard
 Activate your Citibank Debit Mastercard
 Our Wealth Philosophy
 Citi FX Calculator
 Get Travel Insurance Quote
 Apply for Citi Credit Card
 Citi PayAll
 Card Services
 Manage Your Credit Application
 Refer a friend to Citi Credit Card
 Manage Your Mortgage Application
Singapore Quarter 3, 2025
Market commentary
Calm Waters, Selective Tailwinds
KEY HIGHLIGHTS
Residential
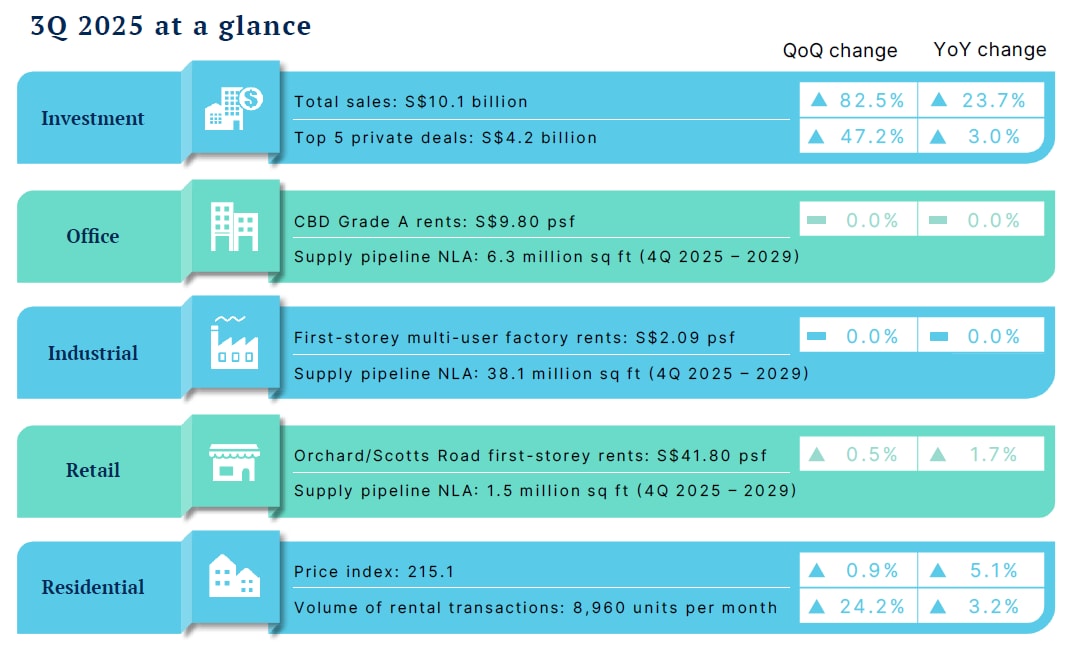
Private home prices rose 0.9% q-o-q in 3Q 2025, led by increases in the landed and non-landed CCR and OCR segments. Transaction volumes grew 44.4% q-o-q to 7,404 units on higher primary sales, while rents edged up 1.2% q-o-q amid steady leasing activity.
Investment
Singapore’s investment sales surged 82.5% q-o-q to S$10.1 billion in 3Q 2025, largely driven by Government Land Sales (GLS) and developers’ preference for well-located sites replete with amenities. Meanwhile, collective sales activity remained muted due to price expectation gap.
Retail
Singapore welcomed 4.5 million international visitors in 3Q 2025 driven by holidays and MICE events. Retail rents are expected to rise modestly in the near term. Leasing activity is likely to focus on relocations, downsizing, and space optimisation as retailers manage rising costs and consumer preferences.
Office
Office rents in the Central Region were stable in 3Q 2025, with the URA rental index easing 0.1 per cent q-o-q and CBD Grade A rents staying unchanged at S$9.80 psf per month. Island-wide occupancy declined marginally by 0.2 percentage points to 94.8 per cent, led by negative absorption in decentralised areas.
ECONOMY
KEY INDICATORS
GDP Growth
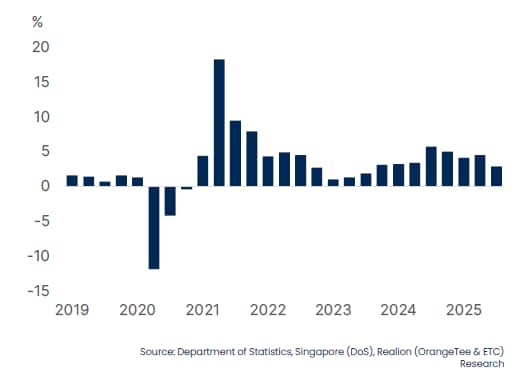
Singapore’s economy grew 2.9% y-o-y in 3Q 2025, down from the 4.5% y-o-y increase in 2Q 2025. On a q-o-q basis, GDP saw a 1.3% growth in 3Q 2025. Based on MTI’s revision in August 2025, GDP growth is projected at 1.5% to 2.5% for 2025.
Inflation
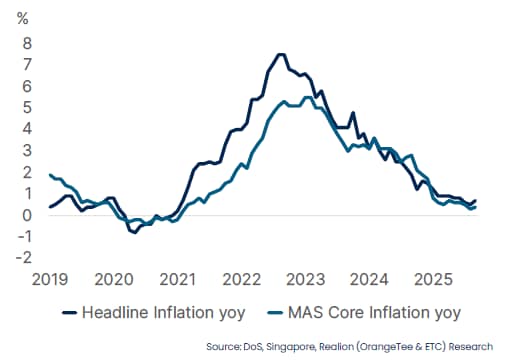
Core inflation fell to 0.4% in September 2025. According to MAS and MTI, imported costs is expected to decline for the rest of 2025, albeit at a slower pace. For 2025, MAS core inflation is expected to average around 0.5%, whereas headline inflation is forecast to average 0.5% to 1.0%.
Non-oil Domestic Exports
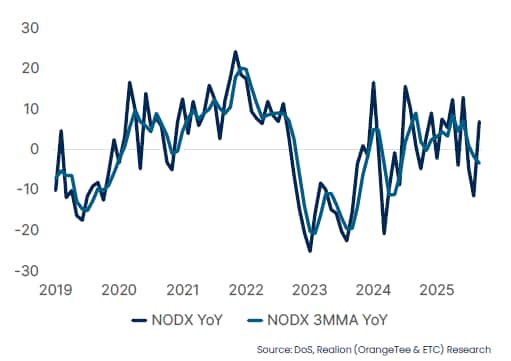
Non-oil domestic exports (NODX) (3MMA) rebounded by 6.9% y-o-y following declines in July and August. The uptick was driven by stronger electronics exports, though near-term prospects remain uncertain amid renewed U.S.–China trade tensions.
International Visitor Arrivals
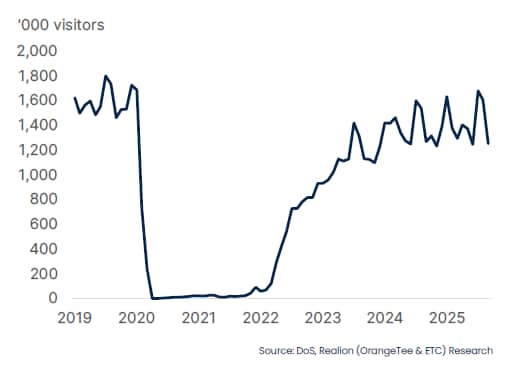
International Visitor Arrivals (IVA) reached 12.9 million year-to-date September 2025, according to STB. IVA is projected to hit 17 to 18.5 million in 2025 with tourism receipts of between $29 billion and $30.5 billion.
INVESTMENT
GLS sites drive strong investment sales
KEY HIGHLIGHTS
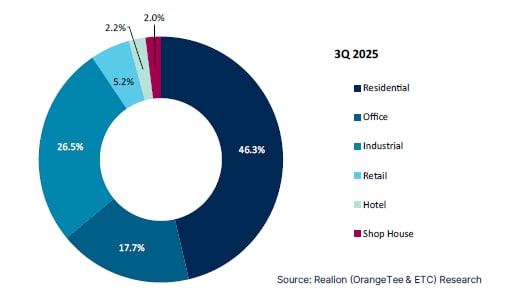
Investment Sales Sectorial Contribution (%)
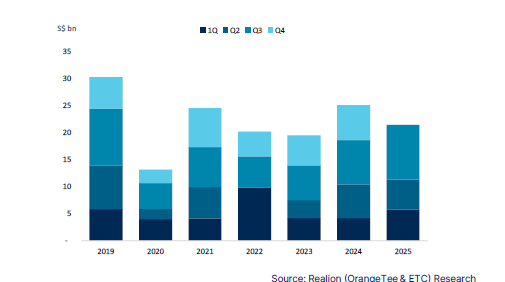
Investment Sales (S$ billion)
Selected Private Investment Sales Transaction Q3 2025
![]()
Market Commentary
- In 3Q 2025, total investment sales in Singapore amounted to S$10.1 billion, marking a 82.5% q-o-q increase from S$5.5 billion in 2Q 2025, and a 23.7%% y-o-y increase from S$8.2 billion in 3Q 2024. Government Land Sales (GLS) accounted for 40.9% of the total investment volume in 3Q through the award of twelve sites.
- Notable sites awarded included Chencharu Close, Chuan Grove and Woodlands Drive (EC), reflecting developers’ growing confidence in well-located plots with strong amenities and transport connectivity.
- Developer’s interest tends to be higher for plots situated near existing or upcoming MRT stations, established residential estates, and retail or lifestyle amenities as these factors enhance the marketability and pricing resilience of future developments.
- The private sector recorded one notable residential collective sale in 3Q 2025, Chiku Mansions, a freehold apartment transacted during the quarter. Overall, enbloc market remained muted amid the gap in pricing expectations between sellers and developers which continued to weigh on transaction activity.
Market Outlook
- The market outlook for investment sales remains cautiously optimistic supported by global interest rate easing and redevelopment opportunities arising from Draft Master Plan 2025. Investors continue to show strong interest in location with strong attributes and assets with value-add opportunities. Overall transaction volumes may remain constrained by the gap in pricing expectation between sellers and buyers. As the gap in pricing narrows, investment momentum is expected to strengthen, particularly for assets with redevelopment potential and in areas undergoing rejuvenation.
- Cumulative investment sales for the first three quarters of 2025 totalled S$21.5 billion. Based on this momentum, the full year 2025 investment sales volume is projected to land within a range of S$24-25 billion.
RESIDENTIAL
Sustained price growth and sales rebound from unyielding resilience
KEY HIGHLIGHTS
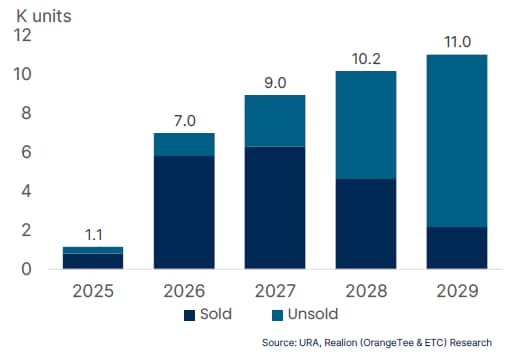
Residential Supply Pipeline
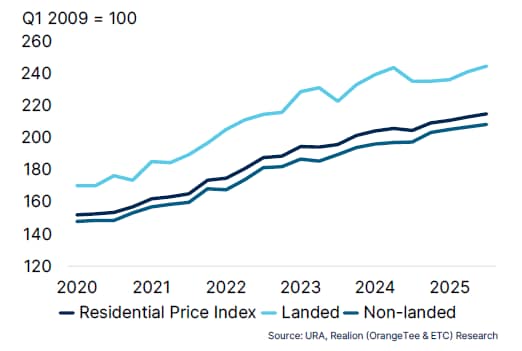
Property Price Index
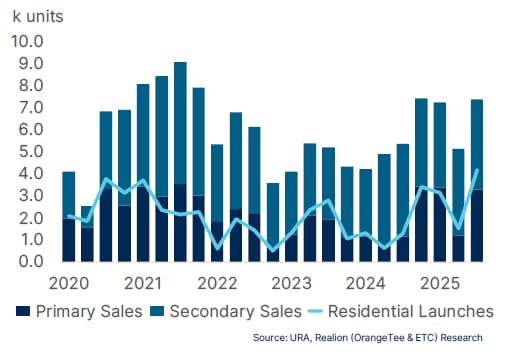
Residential Sales and Launch Volume
Market Commentary
- Singapore’s private residential market demonstrated resilience in 3Q 2025, as prices continue to rise and more sales were being closed. The URA property price index rose by 0.9% q-o-q in 3Q 2025, slightly slower compared to the 1.0% increase in 2Q 2025 but faster than the 0.8% increase in 1Q 2025. Year-to-date, prices have grown by 2.7%, more than the 1.6% increase registered over the same period in 2024.
- Landed prices rose in 3Q 2025, continuing the uptrend in the preceding quarter. URA’s landed property price index climbed by 1.4% in 3Q 2025, a slower pace than the 2.2% growth in 2Q 2025 but faster than the 0.4% increase in 1Q 2025.
- Non-landed property prices grew by 0.8% in 3Q 2025, rising at a slightly faster pace from the 0.7% in 2Q 2025. The CCR non-landed price index rose further by 1.7% but slower when compared to the 3.0% in 2Q 2025. OCR non-landed prices rose by 0.8% in 3Q 2025, lower than the 1.1% in 2Q 2025. Meanwhile, RCR non-landed prices increased by 0.3% in 3Q 2025, reversing the 1.1% drop in 2Q 2025.
- The price growth in the CCR may be attributed to the significant increase in new sale transactions, where transactions rose to 903 units in 3Q 2025 from 44 units in 2Q 2025.
- Overall transaction volumes rebounded strongly by 44.4% q-o-q to 7,404 units, rising from 5,128 units in 2Q 2025. This marks the highest third quarter performance in four years. Primary sales volume soared by 171.3% q-o-q in 3Q 2025 to 3,288 units from 1,212 units in 2Q 2025. Secondary sales demand grew last quarter, at a faster pace of 5.1% compared to 0.8% in Q2 2025. More secondary sale transactions were recorded in 3Q 2025 across all market segments compared to 2Q 2025.
- Rent prices rose modestly, while rental demand stayed robust in 3Q 2025. URA’s rental index increased by 1.2% in 3Q 2025, at a slightly faster pace when compared to the 0.8% in 2Q 2025. This is the first time in nine quarters that the rental prices rose beyond 1%. Rental volume surged by 24.2% to 26,882 in 3Q 2025 from 21,638 units in 2Q 2025. Year-on-year, rental volume increased by 3.2% from 26,037 units in 3Q 2024.
Market Outlook
- Demand for primary sales is expected to hold firm for the rest of 2025. Developers are likely to expedite launches to capitalize on the current positive sales momentum.
- Market sentiment could also be buoyed by easing borrowing costs. The US Federal Reserve lowered interest rates in September and October, with possibly one more rate cut before the end of 2025.
RETAIL
Increased tourist arrivals drive Singapore retail market
KEY HIGHLIGHTS
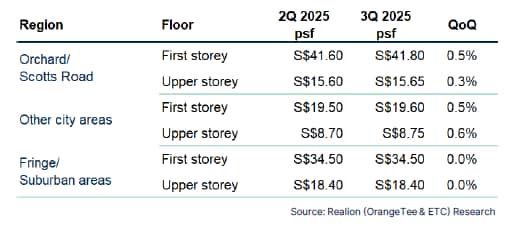
Retail Prime Rental Rents
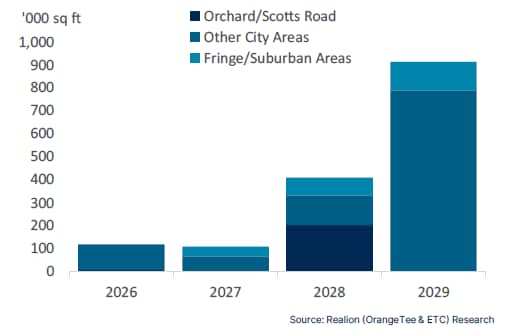
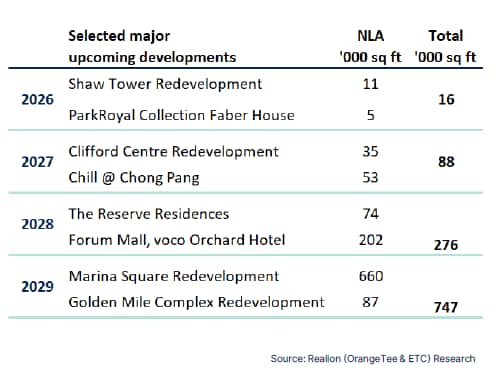
Retail Supply Pipeline (NLA)
Selected Retail Pipeline
Market Commentary
- In 3Q 2025, international visitor arrivals (IVA) stood at 4.5 million, marking a 12.9% increase from 4.0 million visitors in the previous quarter. Year-to-date, total arrivals stood at 12.9 million. The increase in international visitors could be driven by more summer travels, the school holidays and major events. We expect Singapore to be on track to meet the 17 to 18.5 million estimated visitors this year.
- In 3Q 2025, Singapore’s island-wide retail occupancy rate increased to 93.1%, up from 92.9% in the previous quarter, which reflects a broadly stable leasing environment across all market segments. Occupancy in the Fringe/Suburban Areas rose marginally from 93.4% to 93.6%, while Orchard/Scotts Road saw a slightly improvement from 93.1% to 93.5%. Similarly, the Other City Areas occupancy rates increased slightly from 91.5% to 91.8%. Overall, the retail market remained steady with only modest movements quarter-on-quarter.
- During the reviewed quarter, prime first-storey rental rates on Orchard/Scotts Road increased by 0.5% quarter-on-quarter to S$ 41.80 psf, supported by limited new supply and resilient tourism demand. Rents in Other City Areas increased by 0.5% to S$ 19.60 psf, while the Fringe/Suburban Areas held steady at S$34.50 psf.
- The overall rental growth was further supported by active tenant reshuffling and space optimisation within malls. Many retailers have opted to downsize to smaller floor plates to better manage operating costs, effectively driving up rents on a per-square-foot basis. Additionally, rising operation and manpower costs have continued to place upward pressure on retail rents.
Market Outlook
- Retail rents in Singapore are expected to stay resilient in the near term, supported by limited supply and sustained tourism demand. However, rising operating costs and continued manpower pressure are likely to keep retailers cautious. Leasing activities are expected to be more focused on relocations, downsizing or space optimisation.
OFFICE
Office market holds firm in 3Q 2025
KEY HIGHLIGHTS
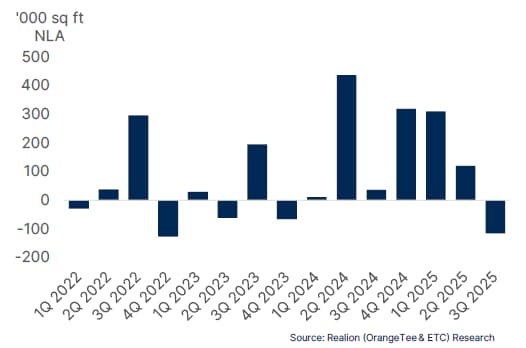
CBD Premium and Grade A Office Net Absorption
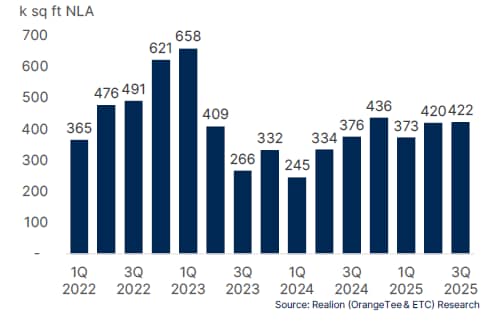
Shadow Space (NLA)
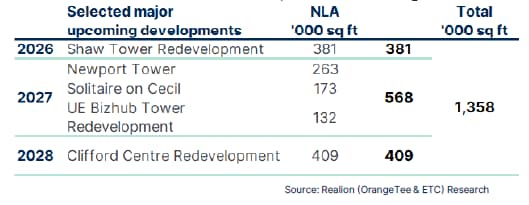
Selected Office Supply Pipeline
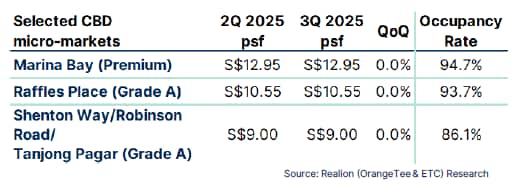
Selected office micro-market rental rates
Market Commentary
- Office rental growth in Singapore’s Central Region remained stable in Q3 2025, as leasing activity was largely driven by renewal contracts amid limited new demand. According to URA, the office rental index in the Central Region declined marginally by 0.1% q-o-q.
- Island-wide occupancy rates eased slightly by 0.2 percentage points to 94.8% in Q3 2025, with a negative net absorption of about 130,000 sq ft NLA.
- The decline was led by the CBD, where occupancy dipped to 93.8% alongside negative net absorption of 87,000 sq ft NLA, mainly due to tenant relocations. Nonetheless, CBD occupancy remains tight amid limited quality space.
- Non-CBD areas saw a slight 0.1 percentage point decline in occupancy and negative net absorption of approximately 12,000 sq ft NLA. The market remained largely stable with subdued activity and minimal tenant movements.
- Occupancy in decentralised areas eased to 94.5% in Q3 2025, reflecting -32,000 sq ft of net absorption, The decline was attributed to Tampines area which saw a negative 333,000 sq ft decline in net absorption, while Paya Lebar area provided partial support with a positive 257,000 sq ft NLA net absorption.
- Shadow spaces ticked up by 0.6 per cent in Q3 2025 to approximately 422,000 sq ft in NLA from the 420,000 sq ft in NLA recorded in Q2 2025. The increase in shadow space, accompanied with negative net absorption, indicates that tenants are making shifts in office spaces and/or subletting the available space until lease expires.
Market Outlook
- According to the MAS, growth momentum is expected to remain resilient through the rest of 2025, supported by sustained global demand and continued AI-related investments. Economic uncertainty has eased following the conclusion of several trade agreements between the US and its trading partners.
- On the domestic front, office rental growth is expected to persist amid a limited supply pipeline from 2025 to 2027. The scarcity of new premium office developments in the CBD will help sustain high occupancy levels and underpin rental stability.
GENERAL DISCLOSURE
DISCLAIMER - EDMUND TIE & COMPANY
This report should not be relied upon as a basis for entering into transactions without seeking specific, qualified, professional advice. Whilst facts have been rigorously checked, Edmund Tie & Company can take no responsibility for any damage or loss suffered as a result of any inadvertent inaccuracy within this report. Information contained herein should not, in whole or part, be published, reproduced or referred to without prior approval. Any such reproduction should be credited to Edmund Tie & Company.
© Edmund Tie & Company 2025
Source: Edmund Tie & Company. Reproduced with permission.
Citibank Disclaimers and Important Notices
DISCLAIMER – CITIBANK
The market data and information herein contained (“Information”) is the product or service of a third party not affiliated to Citibank Singapore Limited (“CSL”) or its related entities. None of the Information represent the opinion of, counsel from, recommendation or endorsement by CSL, its related entities and their respective officers, employees, directors and agents (collectively, the “CSL Group”).
The Information is provided for general information and/or educational purposes only. No part of the Information may be reproduced without the prior written permission of CSL.
NO WARRANTY
The Information is provided “as is”, without warranty of any kind, it has not been independently verified by CSL Group and use of the Information is at your sole risk. The CSL Group shall not be liable and expressly disclaim liability for any error or omission in the content of the Information, or for any actions taken by you or any third party, in reliance thereon. The Information is not guaranteed to be error-free, or to be relied upon for investment purposes, and the CSL Group makes no representation or warranty as to the accuracy, truth, adequacy, timeliness or completeness, fitness for purpose, title, non infringement of third party rights or continued availability of the information.
LIMITATION OF LIABILITY
To the maximum extent permitted by law, the CSL Group shall not be liable for any loss or damage of any kind whatsoever (including, without limitation, any special, consequential, incidental or indirect damages, or damages for loss of profits, business interruption, and any and all forms of loss or damage, regardless of the form of action or the basis of the claim, whether or not foreseeable) arising out of the use of the information (provided in any medium), even if any member of the CSL Group, has been advised of the possibility of such loss or damage.
© 2025 CITIBANK
CITIBANK IS A REGISTERED SERVICE MARK OF CITIGROUP INC. OR CITIBANK, N.A.
CITIBANK SINGAPORE LIMITED. CO REG. NO. 200309485K