 Apply for Citigold
 Citi Wealth Perspectives
 Citi Plus
 Digital Banking
 Apply for International Banking Account
 Citibank Debit Mastercard
 Activate your Citibank Debit Mastercard
 Our Wealth Philosophy
 Citi FX Calculator
 Get Travel Insurance Quote
 Apply for Citi Credit Card
 Citi PayAll
 Card Services
 Manage Your Credit Application
 Refer a friend to Citi Credit Card
 Manage Your Mortgage Application
Singapore Quarter 4, 2025
Market commentary
Holding the line
KEY HIGHLIGHTS
Residential
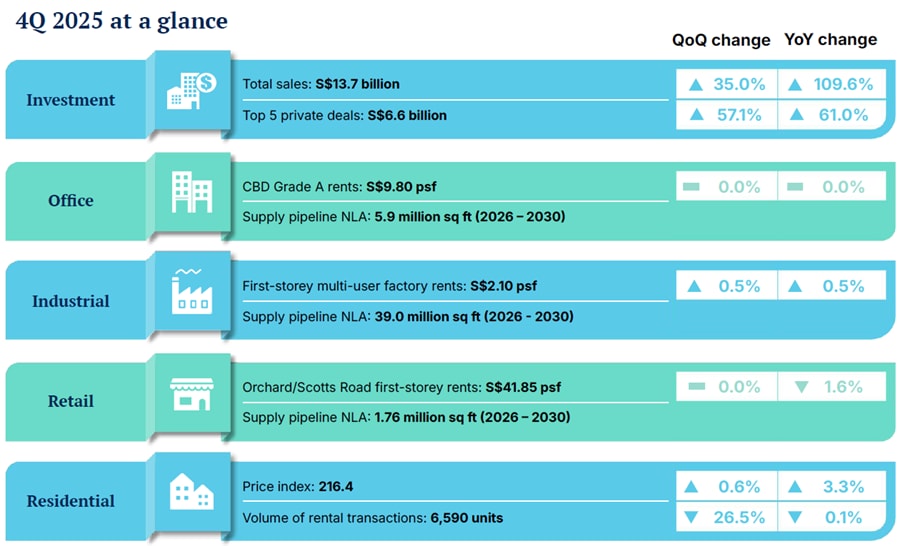
Overall prices in 4Q 2025 grew at a slower pace of 0.6% on the back of fewer project launches. For the whole of 2025, prices rose by 3.3%. Total sales hit a 4-year high in 2025 with 26,492 transactions. Rental prices dipped modestly while rental volume dipped by 27.4% to 19,771 in 4Q 2025 from 27,223 units in the preceding quarter.
Investment
Singaporeʼs investment sales activity strengthened in 4Q 2025 to S$13.7 billion, supported by easing interest rates and currency stability. Buyers showed confidence with increased interest across Government Land Sales, retail, office and industrial segments.
Retail
International visitor arrivals eased to 4.0 million in 4Q 2025, full year arrivals remained resilient at 16.9 million, with STB projecting further growth in 2026. Singaporeʼs retail market remained stable, with island-wide occupancy edging up to 93.7%, supported by resilient demand in Fringe/Suburban Areas and absorption of completed spaces in the city.
Office
Office rents in the Central Region grew 0.4% q-o-q in 4Q 2025 as island-wide occupancy rose to 95.1%, supported by 236,500 sq ft of net absorption. CBD shadow space tightened by 66,000 sq ft, even as total available shadow space increased to 432,000 sq ft NLA island-wide.
ECONOMY
KEY INDICATORS
GDP Growth
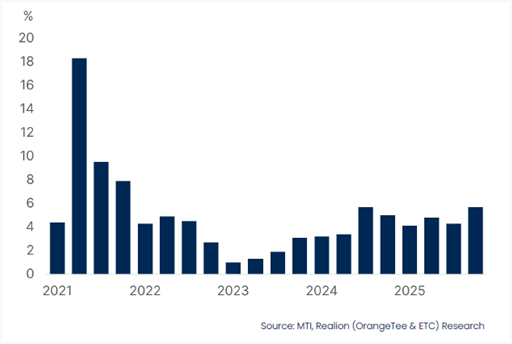
Singaporeʼs economy grew 5.7% y-o-y in 4Q 2025, faster than the 4.3% y-o-y increase in 3Q 2025. According to the Ministry of Trade and Industry MTI, the economy expanded 4.8% in 2025, extending the 4.4% growth in 2024.
Inflation
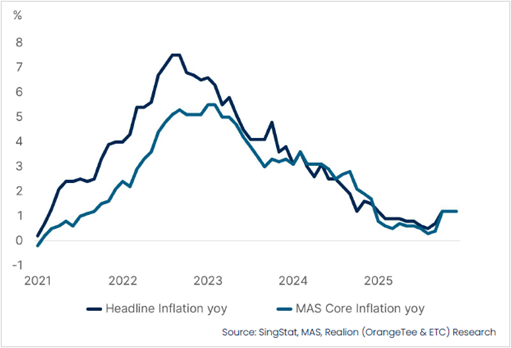
Core inflation rate rose to 1.2% in December 2025 from 0.4% in September 2025. For the whole of 2025, core inflation averaged 0.7%, falling from 2.8% in 2024. According to MAS, Singaporeʼs inflation is expected to edge higher in 2026, driven by firmer domestic cost pressures and steady consumption.
Non-oil Domestic Exports
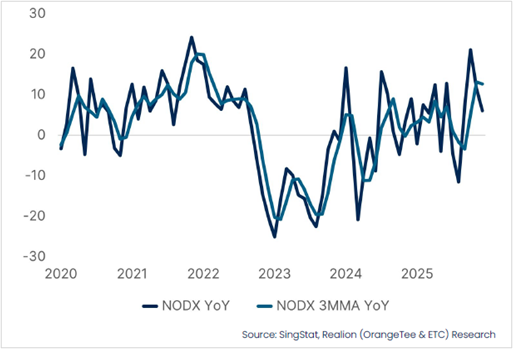
Non-oil domestic exports NODX 3MMA y-o-y) rose to 12.7% in December 2025, reversing the 3.4% decline recorded in September 2025. According to Enterprise SG, the growth was led primarily by non-monetary gold and electronic products.
International Visitor Arrivals
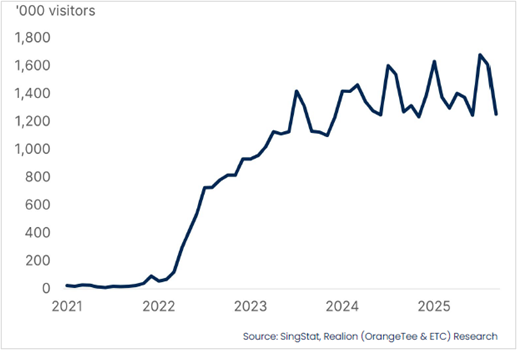
For 2025, total international visitor arrivals reached 16.9 million, representing a 2.3% y-o-y growth compared to 2024. According to Singapore Tourism Board STB, tourism receipts from January to September 2025 hit S$23.9 billion and on track to exceed its projections of S$29 billion and S$30.5 billion for the whole of 2025.
INVESTMENT
Strengthening momentum in 2026
KEY HIGHLIGHTS
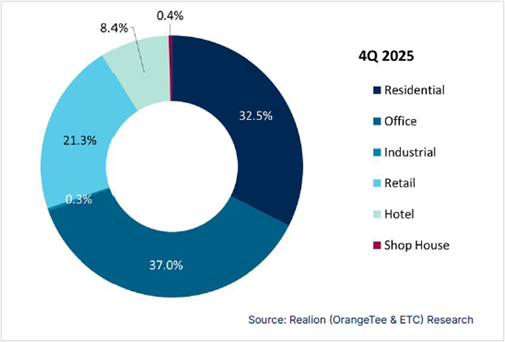
Investment Sales Sectorial Contribution (%)
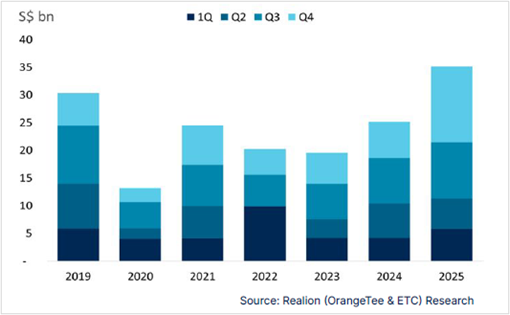
Investment Sales (S$ billion)
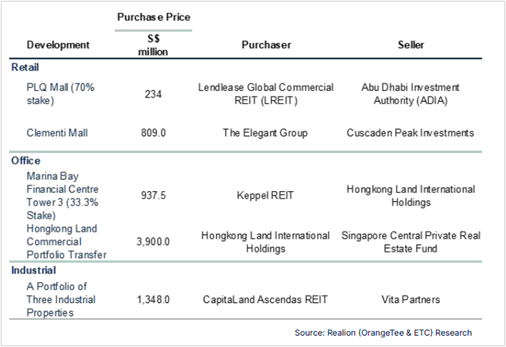
Selected Private Investment Sales Transaction Q4 2025
Market Commentary
- In 4Q 2025, total investment sales in Singapore amounted to S$13.7 billion, marking a 35.0% q-o-q increase from S$10.1 billion in 3Q 2025, but a strong 109.6% y-o-y increase from S$6.5 billion in 4Q 2024. For full year of 2025, investment sales amounted to S$35.0 billion, representing 39.2% increase from S$25.2 billion in 2024. This growth was supported by a higher number of Government Land Sales GLS sites awarded last year.
- During the quarter, eight GLS sites were awarded totalling S$3.3 billion. Notable sites include sites at Telok Blangah Road, Upper Thomson Road Parcel A, Bukit Timah Road, Bedok Rise and Sengkang West, highlighting sustained developer interest across different market segments.
- In the private sector, investment activity during the quarter was concentrated in the residential and retail sectors. One collective sale transaction was recorded in the quarter, Starpoint at Pasir Panjang was acquired by Stalford International Education.
- Retail sector activity was led by the acquisition of Clementi Mall by Elegant Group, as well as Lendlease Globalʼs acquisition of a 70% stakes in PLQ Mall.
- In the office sector, Hongkong Land transferred CBD assets worth S$3.9 billion to Singapore Central Private Real Estate Fund, while Keppel REIT acquired one-third stake of Marina Bay Financial Centre Tower 3.
Market Outlook
- Looking ahead, the investment sale market in 2026 is expected to gain further momentum, driven by factors beyond interest rates alone. Investor sentiments towards office and retail assets is expected to improve, alongside assets offering redevelopments or repositioning potential, as lower financing cost, more accommodative pricing expectations and clear value–add opportunities continue to support transaction activity.
- In addition, the relative stability of the Singapore dollar and Singaporeʼs resilient economic fundamentals are expected to continue positioning the country as a preferred destination for capital preservation, particularly as investors seeks for stable currencies and macroeconomic environments amid ongoing global uncertainties.
RESIDENTIAL
Private home sales hit 4-year high in 2025
KEY HIGHLIGHTS
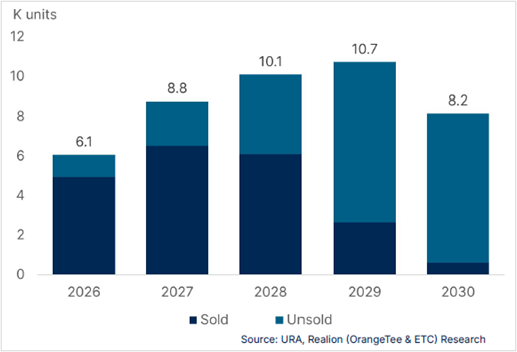
Residential Supply Pipeline
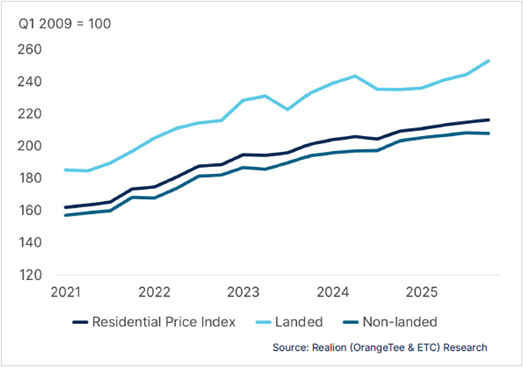
Property Price Index
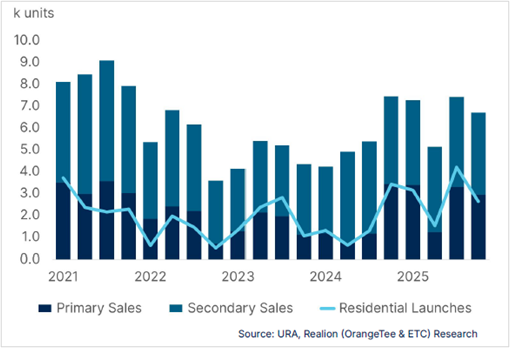
Residential Sales and Launch Volume
Market Commentary
- Private home prices rose further in 4Q 2025, albeit at a slower pace, amid lower transaction volume. According to URA, the overall price index rose by 0.6%, less than the 0.9% increase seen in 3Q 2025.
- For the whole of 2025, private home prices climbed by 3.3% This was a slower pace than the 3.9% growth in 2024, and substantially lower than the growth of 6.8% and 8.6% in 2023 and 2022, respectively. This is also the slowest annual price growth recorded since 2020, when prices increased by 2.2% during the COVID19 pandemic.
- Prices of non-landed properties dipped marginally by 0.2% in the 4Q 2025, reversing the 0.8% gain in the 3Q 2025. Landed prices rose by 3.4% in 4Q 2025, more than the 1.4% increase in the 3Q 2025. Among the sub-markets, prices of non-landed properties increased the most by 1% q-o-q in the OCR, followed by 0.7% in the RCR. In the CCR, prices fell by 3.5%.
- Private home sales volume dipped by 9.5% from 7,404 units in 3Q 2025 to 6,699 units in 4Q 2025 due to fewer primary sales. For the whole of 2025, 26,492 units were transacted, reaching a four-year high. The strong sales were driven by a surge in new sale transactions, which climbed from 6,469 units in 2024 to 10,815 units in 2025. The number of resale transactions similarly rose last year to 14,622 units, up from 14,053 units in 2024. Both the total new sales and resale volumes have similarly reached four-year highs.
- Rental prices dipped modestly in 4Q 2025 on weaker volumes. According to URA residential rental index, private rents dipped marginally by 0.5% in 4Q 2025, reversing the 1.2% growth registered in 3Q 2025. For the full year, rents increased by 1.9%, a reversal from the 1.9% decline in 2024. Similarly, rental volume dipped by 27.4% from 27,223 units in 3Q 2025 to 19,771 units in 4Q 2025. For the full year, private rental volume increased by 3.4% from 86,476 units in 2024 to 89,376 units in 2025, reaching a three-year high.
Market Outlook
- The global economic outlook is expected to remain resilient in 2026 which may prop up property buying sentiment this year. While private home prices are expected to see modest growth this year, price growth will be constrained by fewer launches and transactions, with most new supply concentrated in lower-priced suburban areas.
- Resale completions are expected to remain stable this year, which could continue to exert mild downward pressure on prices, with overall price growth projected at 2.5 to 4.5%, broadly in line with recent years. Private home sales is estimated to hit 23,500 to 25,500 units in 2026. While slightly lower than 2025, it is still at a healthy level when compared with 2022-2024.
RETAIL
Retail demand eases, market remains steady
KEY HIGHLIGHTS
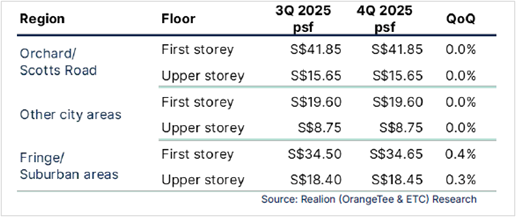
Retail Prime Rental Rents
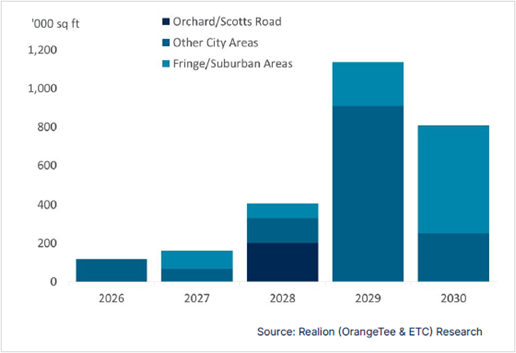
Retail Supply Pipeline (NLA)
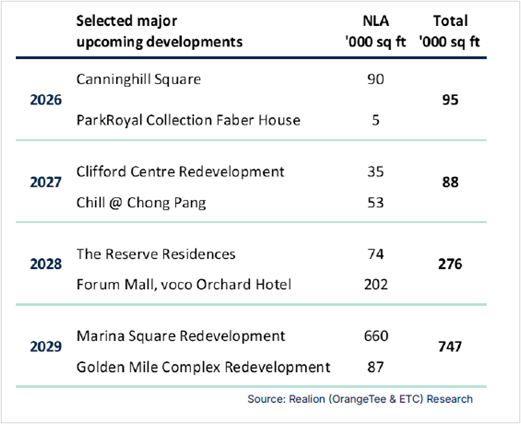
Selected Retail Pipeline
Market Commentary
- In Q4 2025, International Visitor Arrivals (IVA) stood at 4.0 million, marking 11.2 percent decrease from the 4.5 million recorded in the previous quarter. For the whole of 2025, total international visitor arrival reached 16.9 million. According to the Singapore Tourism Board (STB), international visitor arrivals are projected to reach between 17.0 to 18.0 million in 2026, with tourism receipt estimated at between S$31 billion and S$32.5 billion.
- In Q4 2025, Singaporeʼs island-wide retail occupancy rate increased to 93.7 per cent, up from 93.1 per cent in the previous quarter, indicating a generally stable leasing environment supported by steady tenant demand. Occupancy in the Fringe/Suburban Areas rose marginally from 93.6 per cent to 94.2 per cent, as resilient local demand continue to support leasing activity, particularly from food & beverage businesses and essential goods and services operators.
- In contrast, Orchard/Scotts Road saw a slight easing in occupancy from 93.5 per cent to 93.2 per cent potentially reflecting ongoing tenant rotations and selective consolidation by retailers. Meanwhile, occupancy in the Other City Areas increased from 91.8 per cent to 92.7 per cent. This increase in occupancy is absorption-led as completed retail spaces were progressively taken up by operators.
- In 4Q 2025, prime first-storey rental rates on Orchard/Scotts Road remained unchanged at S$41.85 psf, while Other City Areas held steady at S$19.60 psf. Prime first-storey rents in the Fringe/Suburban Areas rose marginally by 0.4 per cent to S$34.65 psf.
Market Outlook
- Retail rental growth is expected to remain modest in the near term, as manpower constraints and rising operating costs continue to weigh on retailersʼ expansion plans. Consequently, leasing demand may soften as tenants become more cautious in committing to space.
- The impact on rents is expected to be mitigated by the limited retail supply pipeline, which should help support occupancy and rental performance. Overall, retail rents are projected to remain broadly stable with modest growth supported by tight supply conditions.
OFFICE
CBD reinforces position as business core in 4Q 2025
KEY HIGHLIGHTS
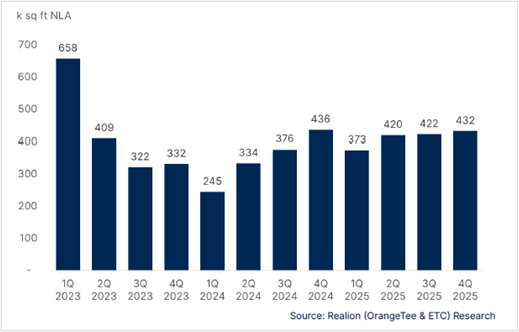
CBD Premium and Grade A Office Net Absorption
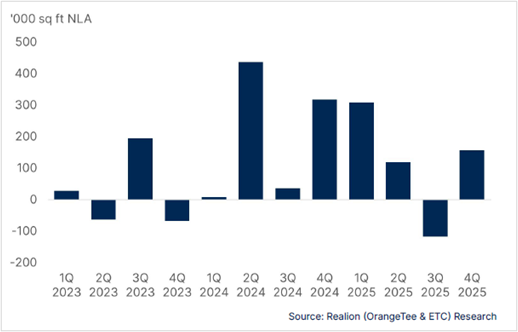
Shadow Space (NLA)
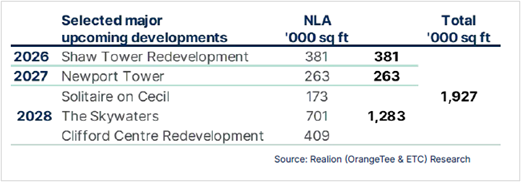
Selected Office Supply Pipeline
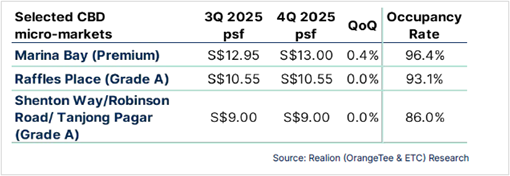
Selected CBD micro-market rents
Market Commentary
- Office rental growth in Singaporeʼs Central Region grew marginally in 4Q 2025, with leasing activity largely driven by contract renewals. According to URA, office rental index for Central Region rose by 0.4% q-o-q in 4Q 2025, reversing the 0.1% decline recorded in 3Q 2025. On a full-year basis, Central Region office rents saw marginal growth of 0.3% in 2025, an increase from 0.0% in 2024.
- Island-wide office occupancy rates rose marginally across all market segments in 4Q 2025 to 95.1%, representing a 0.3 percentage point q-o-q rise and a net absorption of approximately 236,500 sq ft of office space. This increase marks the highest occupancy level recorded since 1Q 2024.
- The improvement in occupancy was primarily driven by the CBD, where occupancy rose by 0.5 percentage points q-o-q to 94.3%. A net absorption of 195,000 sq ft of office space supported the higher occupancy rates. Non-CBD areas of the Central Region recorded stable occupancy at 97.0% alongside marginal negative net absorption. Meanwhile, decentralized areas saw occupancy rise to 94.7%, reversing the previous quarterʼs decline.
- Office shadow spaces increased 2.3% in 4Q 2025, increasing to approximately 432,000 sq ft NLA. CBD areas in particular saw a decline of 66,000 sq ft NLA of available shadow spaces, underscoring the preference for CBD office spaces.
Market Outlook
- According to MTI, Singaporeʼs growth is expected to moderate to 1.0% to 3.0% in 2026, following a 4.8% expansion in 2025. Interest rates has declined in 2025, with consensus expectations that interest rates to trough in 2026. The lower interest environment is supportive of investment activity in the office sector.
- On the supply front, Shaw Tower is the only main completion for 2026, resulting in limited availability of large, contiguous floor plates. The tightness in supply is likely to shift rental pricing power in favour of landlords.
- With steady demand and constrained new supply, CBD Grade A office rents are projected to increase by approximately 3% to 4% in 2026.
GENERAL DISCLOSURE
DISCLAIMER - EDMUND TIE & COMPANY
This report should not be relied upon as a basis for entering into transactions without seeking specific, qualified, professional advice. Whilst facts have been rigorously checked, Edmund Tie & Company can take no responsibility for any damage or loss suffered as a result of any inadvertent inaccuracy within this report. Information contained herein should not, in whole or part, be published, reproduced or referred to without prior approval. Any such reproduction should be credited to Edmund Tie & Company.
© Edmund Tie & Company (SEA) Pte Ltd (ETC)
Source: Edmund Tie & Company. Reproduced with permission.
Citibank Disclaimers and Important Notices
DISCLAIMER – CITIBANK
The market data and information herein contained (“Information”) is the product or service of a third party not affiliated to Citibank Singapore Limited (“CSL”) or its related entities. None of the Information represent the opinion of, counsel from, recommendation or endorsement by CSL, its related entities and their respective officers, employees, directors and agents (collectively, the “CSL Group”).
The Information is provided for general information and/or educational purposes only. No part of the Information may be reproduced without the prior written permission of CSL.
NO WARRANTY
The Information is provided “as is”, without warranty of any kind, it has not been independently verified by CSL Group and use of the Information is at your sole risk. The CSL Group shall not be liable and expressly disclaim liability for any error or omission in the content of the Information, or for any actions taken by you or any third party, in reliance thereon. The Information is not guaranteed to be error-free, or to be relied upon for investment purposes, and the CSL Group makes no representation or warranty as to the accuracy, truth, adequacy, timeliness or completeness, fitness for purpose, title, non infringement of third party rights or continued availability of the information.
LIMITATION OF LIABILITY
To the maximum extent permitted by law, the CSL Group shall not be liable for any loss or damage of any kind whatsoever (including, without limitation, any special, consequential, incidental or indirect damages, or damages for loss of profits, business interruption, and any and all forms of loss or damage, regardless of the form of action or the basis of the claim, whether or not foreseeable) arising out of the use of the information (provided in any medium), even if any member of the CSL Group, has been advised of the possibility of such loss or damage.
© 2026 CITIBANK
CITIBANK IS A REGISTERED SERVICE MARK OF CITIGROUP INC. OR CITIBANK, N.A.
CITIBANK SINGAPORE LIMITED. CO REG. NO. 200309485K